|
Photo Galleries
|
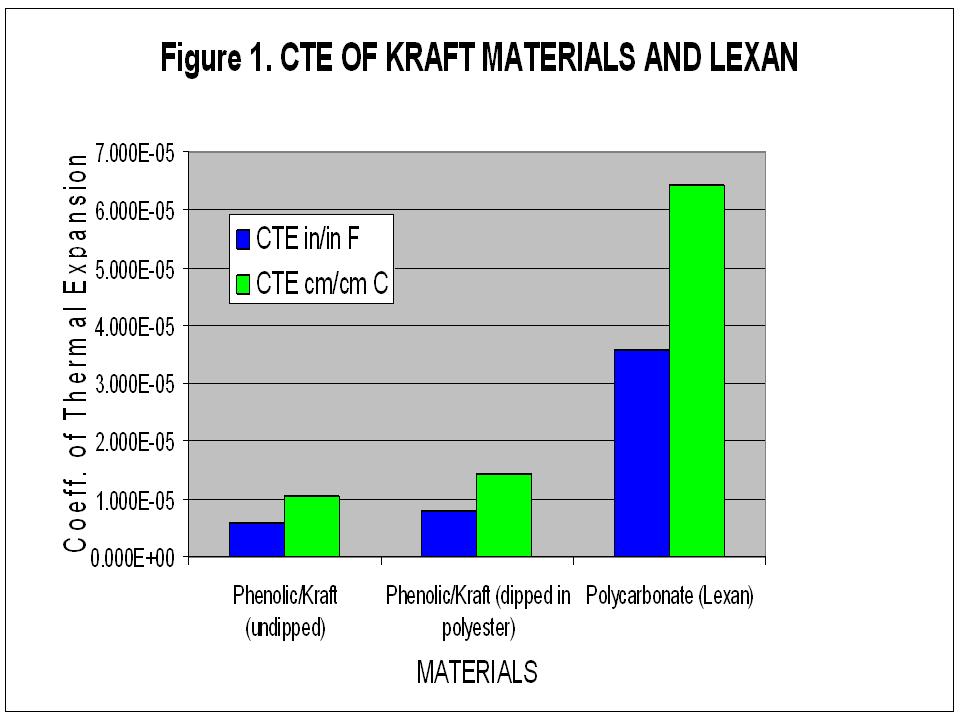
Example of Recent Non-Fiber Related Engineering Analysis:In a recent analysis, we needed to evaluate the performance
characteristics of various materials for use in a structural canister
used to hold chopped carbon fibers. Because literature data were not
available, the coefficient of thermal expansion (CTE) was measured
experimentally for one of the candidate materials, a Kraft
paper/phenolic tube. A sample of Lexan polycarbonate sheet was also
measured as a control and compared to data found in the literature for
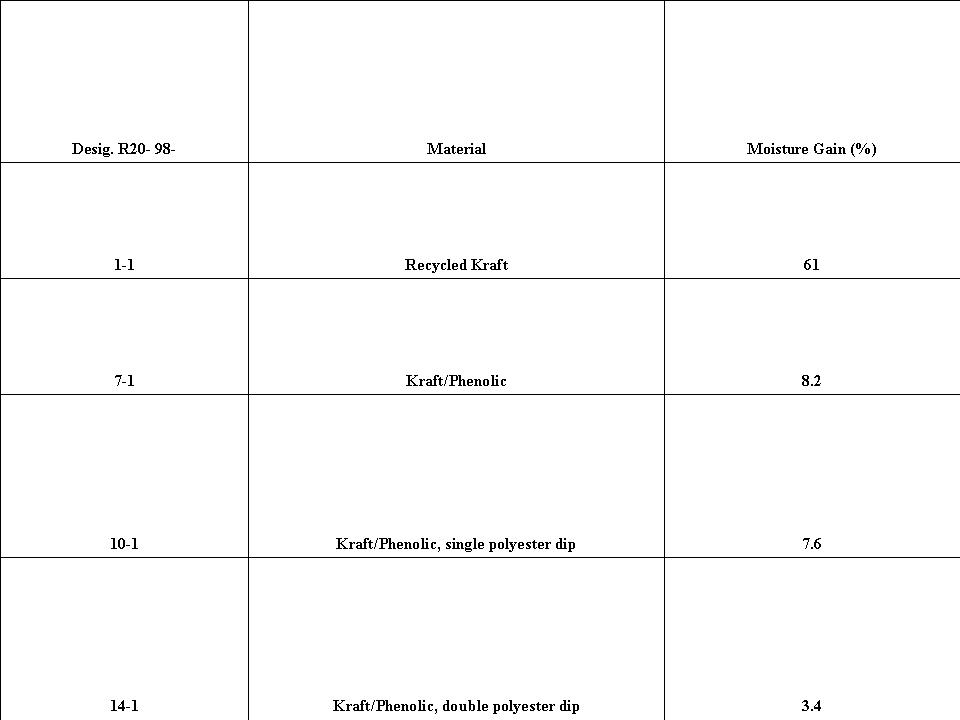
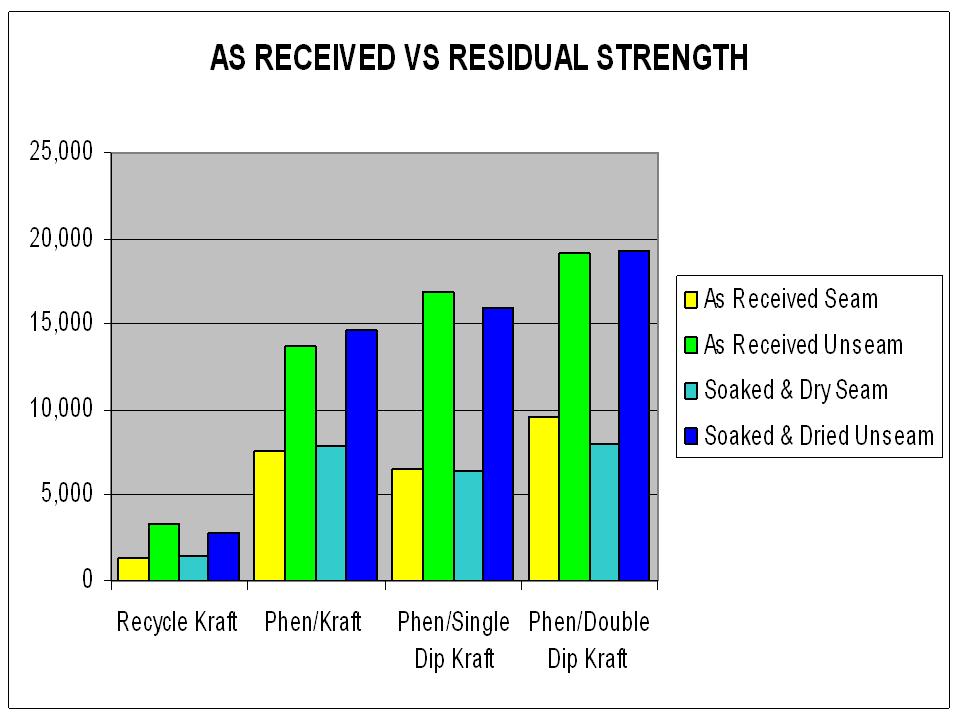
Lexan. Additional mechanical and physical property data were needed for these candidate materials as well. For example, we measured the moisture pickup of the various tube candidate materials. This was done by cutting samples from the tubes, sealing the cut edges with epoxy, and weighing each sample. The samples were then soaked by immersing in tap water for 48 hours and obtaining a wet weight. This was taken as a worst-case scenario. The samples were then dried at 120C for 24 hours and re-weighed. The dried sample weights were determined to be very similar to the dry weights before immersion in water. The moisture gain was determined from the weights measured after immersion and after drying. The data were as follows: FIGURE 2The data show a large moisture gain for the recycled Kraft
material. In fact, this material was not very strong in its wet state.
There was not much difference between the undipped and single- dipped
samples while the double-dipped samples showed the least moisture gain.
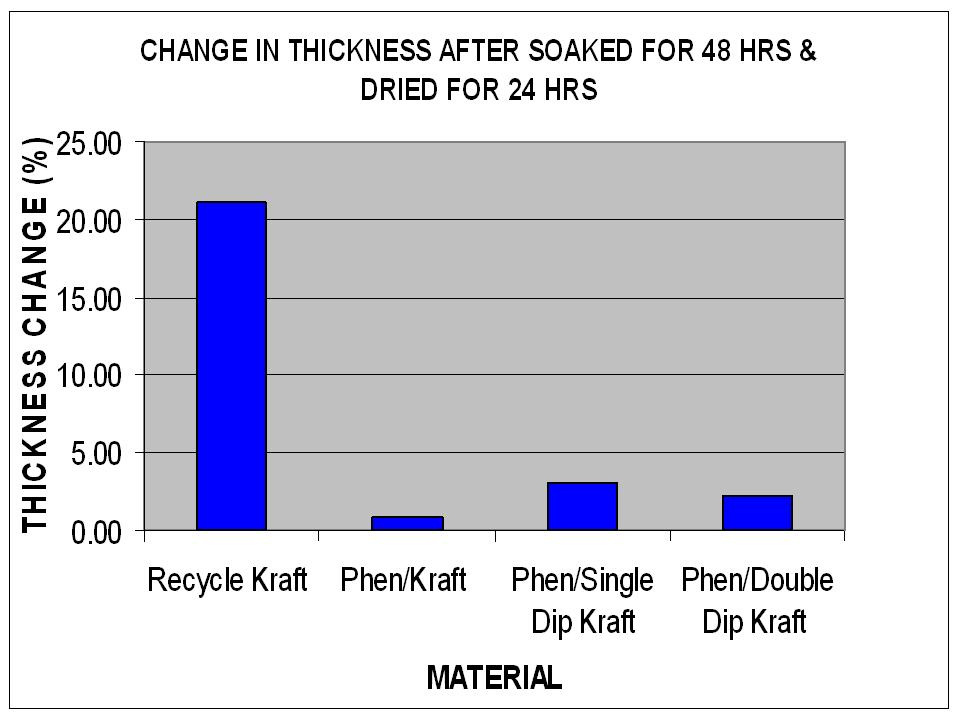
As mentioned, the samples all came back to their original weight after
drying. The data again show the recycled Kraft to be the poorest of
the samples. Interestingly, the undipped sample changed the least in
thickness, even compared to the dipped samples. This could be due to a
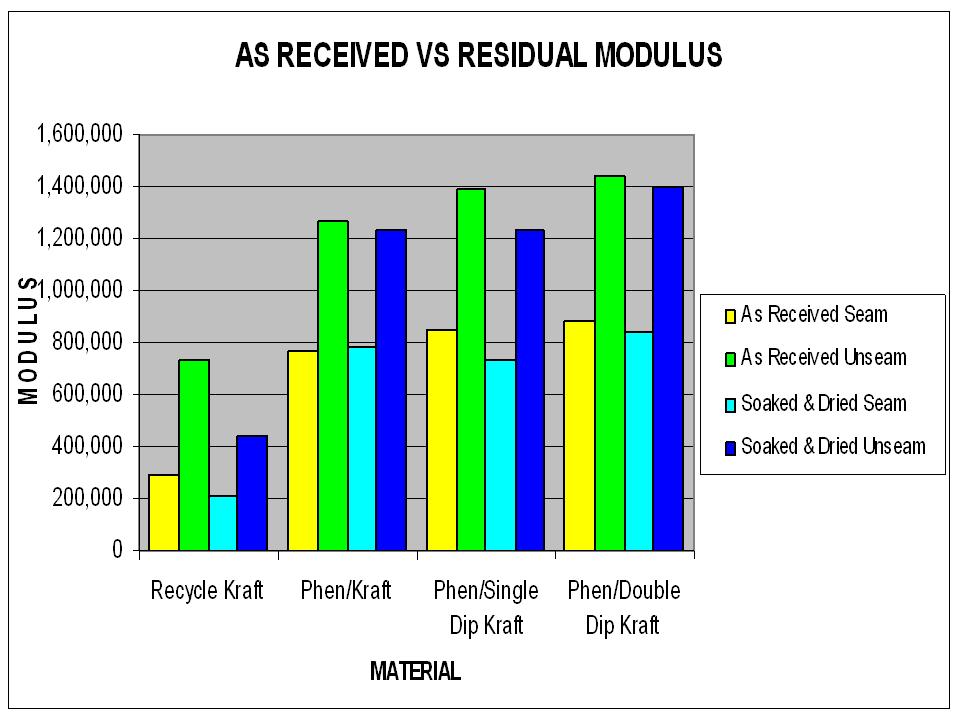
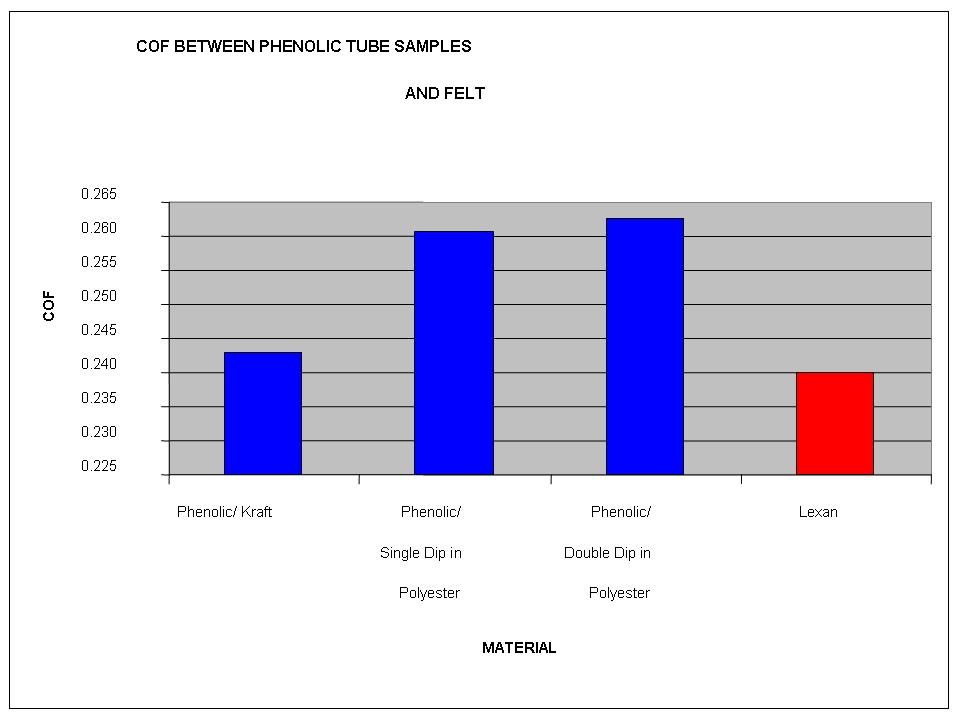
swelling of the polyester from the moisture. FIGURE 4 FIGURE 5 The data suggest the following: The recycled Kraft samples perform poorly both as-received and after soaking/drying compared to the phenolic based samples. As would be expected, the unseamed samples have higher strength and modulus compared to the seamed samples, both before and after exposure to moisture/drying. In general, the properties of the dipped samples are higher than the phenolic/undipped, showing the polyester does provide some degree of stiffening and strength, probably by providing enhanced resin impregnation to the composite. However, all the phenolic based samples are significantly higher in properties (e.g. 3-4 x higher in stiffness) than the Lexan polycarbonate used previously. There is no significant degradation in properties after soaking/drying. Coefficient of Friction (COF) testing - The coefficient of friction was measured between the phenolic based samples and a felt based material used in the design of the system of interest and compared to Lexan/felt. The following data were obtained: FIGURE 6 It is clear that the COF of the Lexan and Phenolic/Kraft samples are similar while the polyester dipped samples are significantly higher. This was evident qualitatively as well as the polyester dipped samples were much rougher to the touch. Based on these various tests and analyses we were able to recommend a suitable candidate material for this application. |